A couple of weeks ago I spoke with a sales leader who was frustrated because his team wasn’t getting consistent results from their outbound sales efforts.
In short, they weren’t hitting quota consistently.
When I asked him why he thought this was happening, he paused for a moment.
“I’m just not sure outbound works for us,” he finally said.
“Oh, is there any specific reason you think that?”
“Well, the reps keep mentioning it’s hard to reach the right people. They spend a lot of time reaching out, but it seems like they only close deals from inbound leads or companies we already know.”
“When you say they spend a lot of time reaching out, do you have a sense of their typical daily time commitment and call volume?”
“Not really.”
“So, you don’t really know?”
“Uhm… no. But that’s what the reps say, and that’s what the deal stats seem to suggest.”
But when we started looking into the actual data, we quickly discovered the real issues:
- The call volume simply wasn’t there. Each rep made around 5-10 calls scattered throughout the day.
- There was little consistency. Some weeks, reps made calls regularly; other weeks, they barely did anything to build pipeline.
- Most outbound efforts were emails, and they weren’t generating many responses.
All in all, the reps simply weren’t putting in the consistent effort needed to build momentum.
Now, there were multiple issues to untangle in this case, and it won’t be an overnight fix.
But I wanted to start with the basics – the concept of “what gets measured gets done.”
So here’s the situation again:
- They need to close more business.
- They’re not getting enough from inbound and existing customers alone.
- To improve outbound, they must consistently generate conversations and meetings.
Getting clear on the metrics: Input, Throughput, and Output
We started by creating a clear view of their outbound sales funnel, focusing on:
- Input: How many new leads are added to their outreach list, and how many calls reps are making.
- Throughput: How many contacts actually pick up the phone (connect rate).
- Output: How many of those conversations lead to meetings booked.
In HubSpot, a great way to visualize this clearly is by using the funnel report builder.
There are different ways to track journey of each contact, but in general it would be through lifecycle stages, Lead stages, or Deal stages.
In this example, I'm using Lead stages (through the Leads Object):
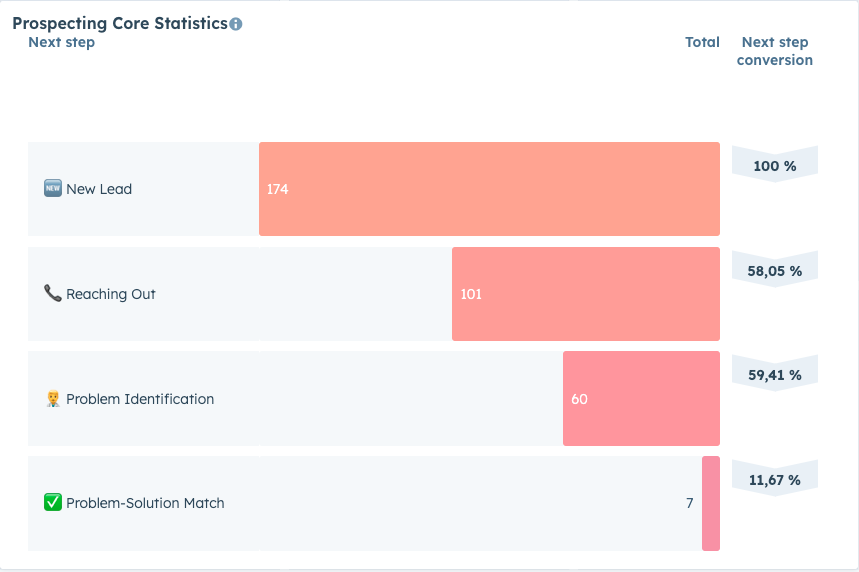
At a minimum, you should track:
- Number of new leads added to outreach lists
- Number of leads attempted (calls made)
- Number of leads who picked up the phone (connected)
- Number of meetings booked from those conversations
This gives you clear visibility into your team’s overall conversion rates (and individual rep performance).
Benchmark data to guide your team
According to Gong’s data (from the book “Cold Calling Sucks”), here are some helpful benchmarks for context:
Connect rate (percentage of calls answered):
- Average Rep: 5.4%
- Top Rep: 13.3%
Meeting set rate (percentage of connects converted to meetings):
- Average Rep: 4.6%
- Top Rep: 16.7%
Benchmarking your team’s performance against industry standards helps you quickly pinpoint areas that need improvement.
When you understand where you’re doing well and where there’s room for growth, it’s easier to take focused action.
Tracking daily activities
When we understand where we're doing well, and where there is room for improvement, it's easier to take focused action.
In most cases, the issue is a combination of various things, but the first realization is almost always that the volume is far too low.
While sales is not purely a volume game, it is part of the game.
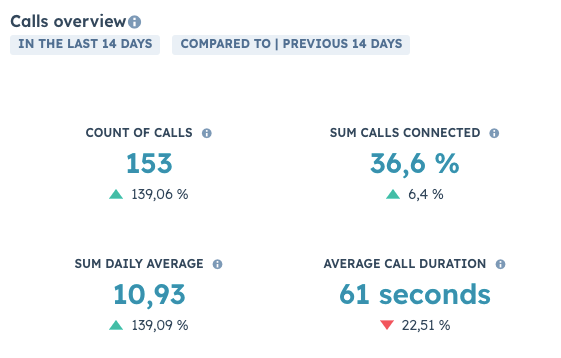
While the funnel helps us understand how each contact is moving through the funnel, we also need to get more insights into the call volume and the connect rate.
This is where I like using the following report:
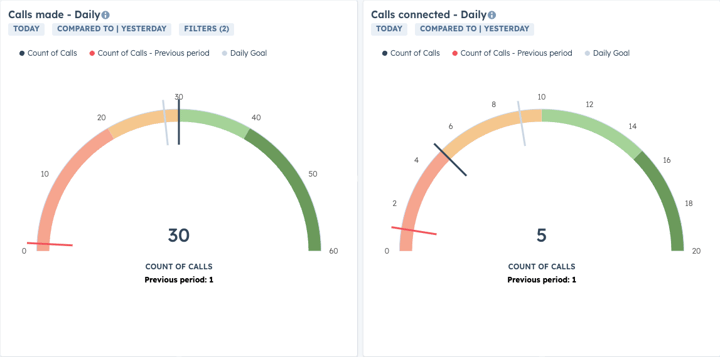
And finally, for the daily activities, my go to is the good ol' "speedometer" dashboards.
For this, I love using simple KPIs visualized through HubSpot’s “speedometer” dashboards.
Your goals here will depend on the role, your ideal customer profile (ICP), and your specific situation.
I recommend setting a combination of:
- Daily call goals
- Daily connected call goals
Why both? Because some days, prospects pick up the phone like crazy, and your reps won’t hit total call volume goals – but they’ll have meaningful conversations.
Other days, they’ll hit voicemail after voicemail, and the connect rate will be low.
Calls don’t pay the bills, but they’re a start
And yes, yes, I know... Calls don’t pay the bills.
But without sufficient volume, you can’t accurately assess where your next bottleneck or “slowest walker” is hiding – your current weak spot in the sales process.
Identifying that weak spot might be a team-wide issue, or it could vary by individual rep (in my opinion, you should always review both).
This simple structure – tracking clear metrics and visualizing them consistently – won’t change your growth trajectory overnight.
But it will put you ahead of most companies, which surprisingly don’t follow this basic discipline.
And the reality is, most don’t.


