One thing I see more and more frequently in CRM fields and tags is the use of emojis. What used to be icons in a few selected places have turned into emojis as the main way to add visual indications next to statuses, fields, navigations and explanations.
Where icons are not a planned part of the UI, an emoji can simply be added to any label or text field, leaving it up to you to decide how to work with your visual interface. The idea is not to cram in as many funny icons as possible, but rather to carefully plan out what elements on the page is most relevant for the user, and make those elements the easiest to recognize. In a table of only black numbers on white text, the green or red icon will stand out immediately, drawing your attention to the key metrics.
I was playing around with these emojis while working on a progression indicator when the thought hit me. What about a progress bar? That should be easy enough, right? So I decided to make one in a calculated field, and here is how it works:

The progress bar is not "actually" a progress bar here, but it can easily function as one. I've simply put green π© and black β¬ Squares next to each other, depending on a percentage value. for each completed 10% reached, there will be one greenπ©, and the remaining squares are black to visualize the full 100%.
To create one, simply set up a new property in HubSpot, choose the field type "Calculation", and copy the formula below:
if(is_known([properties.progress]), if(([properties.progress] < 0.1), "β¬β¬β¬β¬β¬β¬β¬β¬β¬β¬", if(([properties.progress] < 0.2), "π©β¬β¬β¬β¬β¬β¬β¬β¬β¬", if(([properties.progress] < 0.3), "π©π©β¬β¬β¬β¬β¬β¬β¬β¬", if(([properties.progress] < 0.4), "π©π©π©β¬β¬β¬β¬β¬β¬β¬", if(([properties.progress] < 0.5), "π©π©π©π©β¬β¬β¬β¬β¬β¬", if(([properties.progress] < 0.6), "π©π©π©π©π©β¬β¬β¬β¬β¬", if(([properties.progress] < 0.7), "π©π©π©π©π©π©β¬β¬β¬β¬", if(([properties.progress] < 0.8), "π©π©π©π©π©π©π©β¬β¬β¬", if(([properties.progress] < 0.9), "π©π©π©π©π©π©π©π©β¬β¬", if(([properties.progress] < 1), "π©π©π©π©π©π©π©π©π©β¬", "π©π©π©π©π©π©π©π©π©π©")))))))))), "N/A")
The 10 entangled if-functions can make this hard to read, but it will basically just check one condition after the next. You can even adapt this further based on your own preferences. Here is an example of the same progress bar, but rounding to the closest 10% instead of always rounding down, and with different colors based on how far along you are:
if(is_known([properties.progress]), if(([properties.progress] < 0.05), "β¬β¬β¬β¬β¬β¬β¬β¬β¬β¬", if(([properties.progress] < 0.15), "π₯β¬β¬β¬β¬β¬β¬β¬β¬β¬", if(([properties.progress] < 0.25), "π₯π₯β¬β¬β¬β¬β¬β¬β¬β¬", if(([properties.progress] < 0.35), "π₯π₯π₯β¬β¬β¬β¬β¬β¬β¬", if(([properties.progress] < 0.45), "π¨π¨π¨π¨β¬β¬β¬β¬β¬β¬", if(([properties.progress] < 0.55), "π¨π¨π¨π¨π¨β¬β¬β¬β¬β¬", if(([properties.progress] < 0.65), "π¨π¨π¨π¨π¨π¨β¬β¬β¬β¬", if(([properties.progress] < 0.75), "π©π©π©π©π©π©π©β¬β¬β¬", if(([properties.progress] < 0.85), "π©π©π©π©π©π©π©π©β¬β¬", if(([properties.progress] < 0.95), "π©π©π©π©π©π©π©π©π©β¬", "π©π©π©π©π©π©π©π©π©π©")))))))))), "N/A")
And if you want to be a complete maniac, you can even use the colors or shapes to give more accurate results. Here is an example of a different shape to indicate each 5% instead of just 10% intervals:
if(is_known([properties.progress]), if(([properties.progress] < 0.05), "β¬β¬β¬β¬β¬β¬β¬β¬β¬β¬", if(([properties.progress] < 0.1), "π’β¬β¬β¬β¬β¬β¬β¬β¬β¬", if(([properties.progress] < 0.15), "π©β¬β¬β¬β¬β¬β¬β¬β¬β¬", if(([properties.progress] < 0.2), "π©π’β¬β¬β¬β¬β¬β¬β¬β¬", if(([properties.progress] < 0.25), "π©π©β¬β¬β¬β¬β¬β¬β¬β¬", if(([properties.progress] < 0.3), "π©π©π’β¬β¬β¬β¬β¬β¬β¬", if(([properties.progress] < 0.35), "π©π©π©β¬β¬β¬β¬β¬β¬β¬", if(([properties.progress] < 0.4), "π©π©π©π’β¬β¬β¬β¬β¬β¬", if(([properties.progress] < 0.45), "π©π©π©π©β¬β¬β¬β¬β¬β¬", if(([properties.progress] < 0.5), "π©π©π©π©π’β¬β¬β¬β¬β¬", if(([properties.progress] < 0.55), "π©π©π©π©π©β¬β¬β¬β¬β¬", if(([properties.progress] < 0.6), "π©π©π©π©π©π’β¬β¬β¬β¬", if(([properties.progress] < 0.65), "π©π©π©π©π©π©β¬β¬β¬β¬", if(([properties.progress] < 0.7), "π©π©π©π©π©π©π’β¬β¬β¬", if(([properties.progress] < 0.75), "π©π©π©π©π©π©π©β¬β¬β¬", if(([properties.progress] < 0.8), "π©π©π©π©π©π©π©π’β¬β¬", if(([properties.progress] < 0.85), "π©π©π©π©π©π©π©π©β¬β¬", if(([properties.progress] < 0.9), "π©π©π©π©π©π©π©π©π’β¬", if(([properties.progress] < 0.95), "π©π©π©π©π©π©π©π©π©β¬", if(([properties.progress] < 1), "π©π©π©π©π©π©π©π©π©π’", "π©π©π©π©π©π©π©π©π©π©")))))))))))))))))))), "N/A")
This will give you a whooping 22(!) different visual outcomes, and more than enough accuracy to see how things are going.

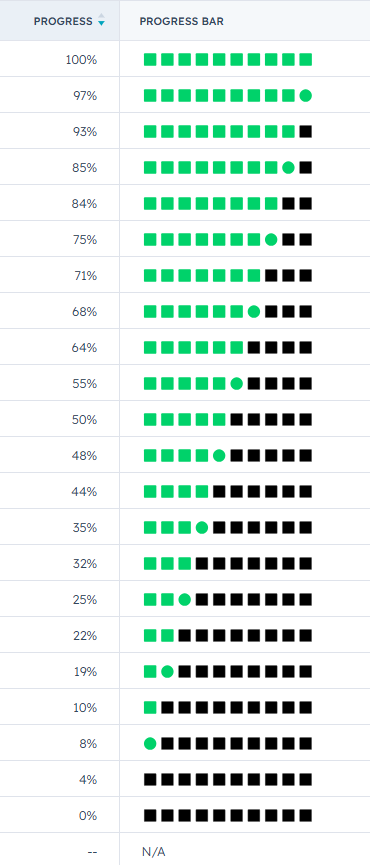
Feel free to copy and adjust my formula here and remember to have fun with it, but not too much fun π