Three key reports to help you maintain your sales momentum
Pipeline coverage- Question: do we have enough potential revenue in the pipeline to hit the number this period?
- How: total amount of all deals with close date in the period ÷ quota for that period
- Question: are we backfilling what we’re winning, losing, or pushing out?
- Pipeline Replacement Rate (PRR): in‑period pipeline created ÷ pipeline removed (Won + Lost + Pushed beyond the period)
- Healthy ≥ 1.0; growth 1.2–1.5+
- Question: are we backfilling what we’re converting or disqualifying?
- Example: If Lead→Opportunity conversion is 10%, you need ~10 net‑new leads to produce one new opportunity
- Tie weekly lead targets to your actual conversion math, not board room math. Hope is not a strategy
- Pipeline coverage: 2–3x for SMB/velocity motions; 3–5x when cycles are longer or win rates are lower
- Pipeline + Lead replacement: PRR ≥ 1.0 to maintain; 1.2–1.5+ to grow
How to calculate it
An important note before we dive into the numbers: almost all companies I work with were (or are) facing issues with a big zombie pipeline.
Especially the lost leads and deals tend to be left open far too long, and close dates gets pushed forward month after month with no end in sight. If this is true for you (it probably is), you have an artificially high close rate and a too high pipeline value.
So while building pipeline should be the main thing, pipeline hygiene is extremely important as well.
Not only will your data lie to you. You'll also have a complete mess of a CRM with time where deals fall through the cracks, follow-ups are missed, and you're unable to spot issues and coaching opportunities as your data is all over.
But with that being said, here's the quick math to explain the concept:
Pipeline Coverage: required coverage ≈ 1 / win rate.
- 25% win rate → ~4x coverage
- 33% win rate → ~3x coverage
- Example: Q4 target €150k, win rate 25% → you want ~€600k of pipeline with close date in Q4
Replacement math:
- Example: In October you created €80k. You won €25k, lost €45k, pushed €10k → removed €80k. PRR = 1.0. You held the line but didn’t grow.
Lead replacement:
- Example: You want 20 new opps next month. At 12% Lead→Opp, you need ~167 leads to replace the 20 opps you closed won/lost or pushed the close date on.
How to set this up in HubSpot
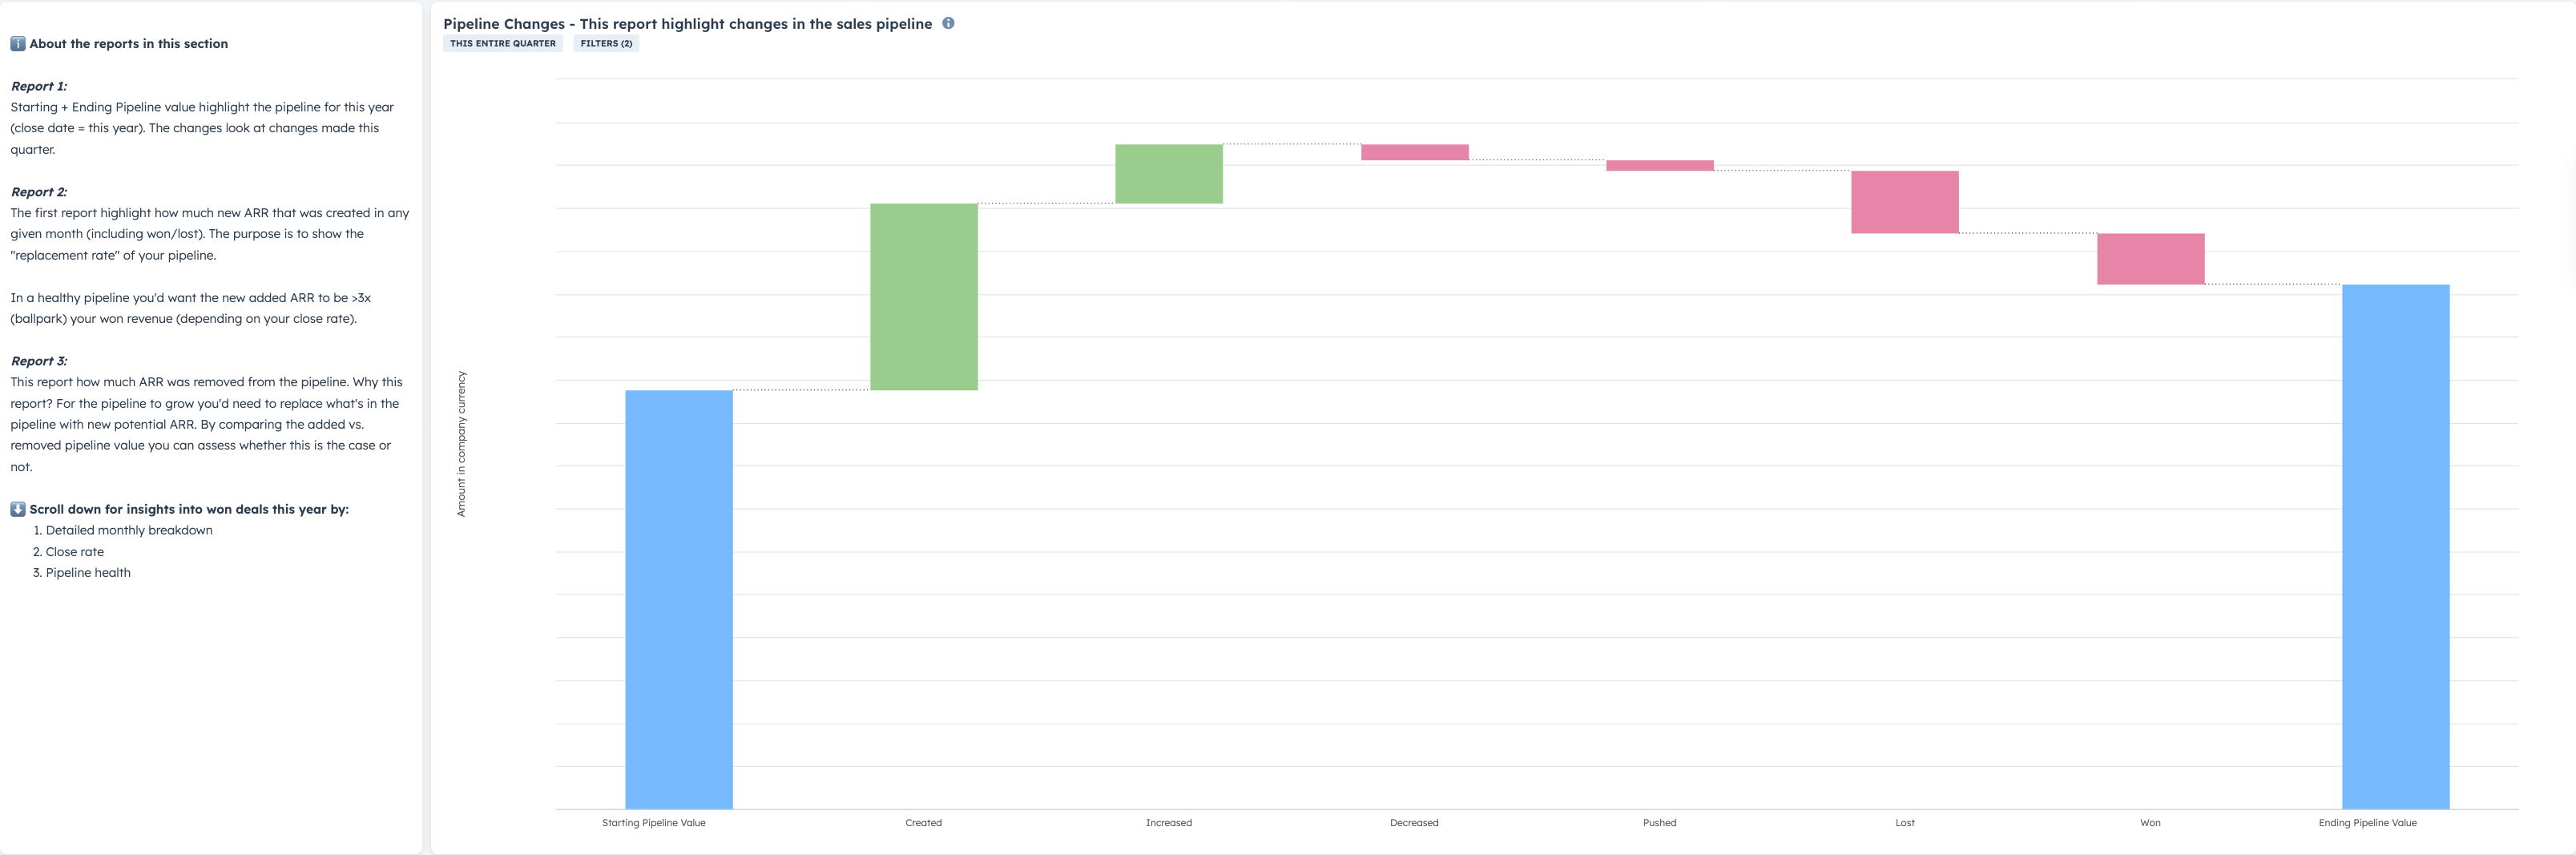
1) Sales Waterfall
- Where: Reports → Analytics Tools → Sales Analytics → Sales Waterfall
- Filters:
- Close date = This year (or This quarter/This month)
- Change period = This quarter (or the period you’re reviewing)
- Pipeline = your active sales pipeline(s)
- How to read it:
- Starting pipeline = value scheduled to close in the period when it began
- Created = new deals added with Close date in the period
- Increased / Decreased = amount changes
- Pushed = deals moved out of the period
- Won / Lost = removed from the pipeline
- Ending pipeline = what’s the current ending pipeline value for the period
- What to look for:
- Is Created + Increased consistently greater than Won + Lost + Pushed? If not, PRR < 1.0 and your pipeline is shrinking.
- Below is an example of a positive trend with a PRR of ~ 1.2
2) Trend add vs. remove
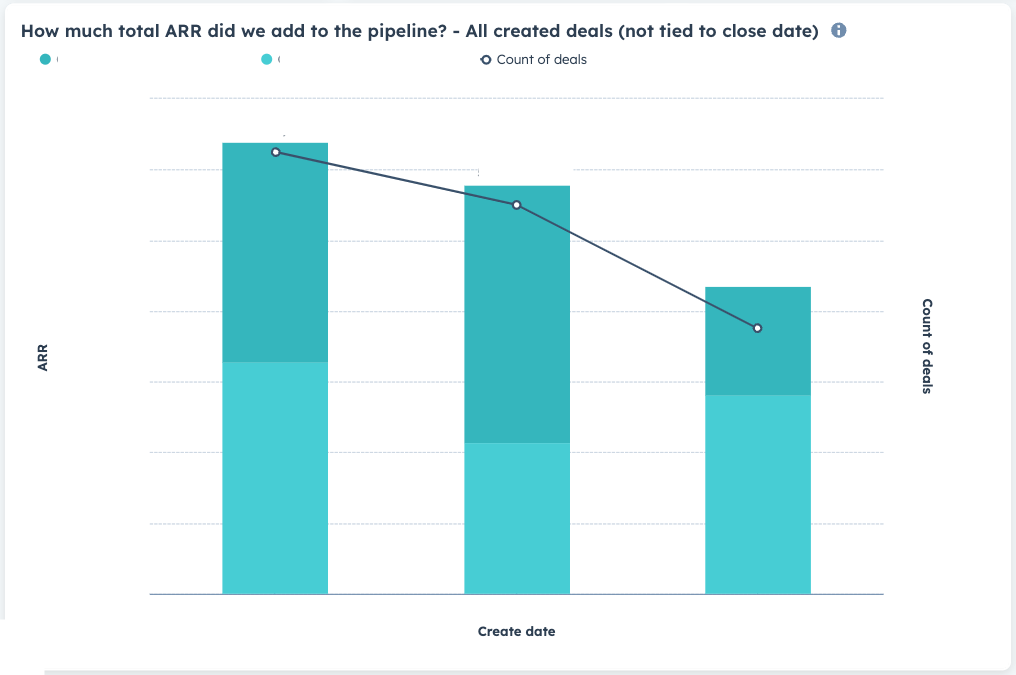
- Report A: “How much total ARR did we add?”
- Builder: Custom report → Single object → Deals
- Filter: Create date = This year (or Last 12 months)
- Display: Quarterly (or Monthly) stacked bars, Sum of Amount in company currency, with a line for Count of deals
- Optional breakdown: Pipeline, Deal owner, or Source
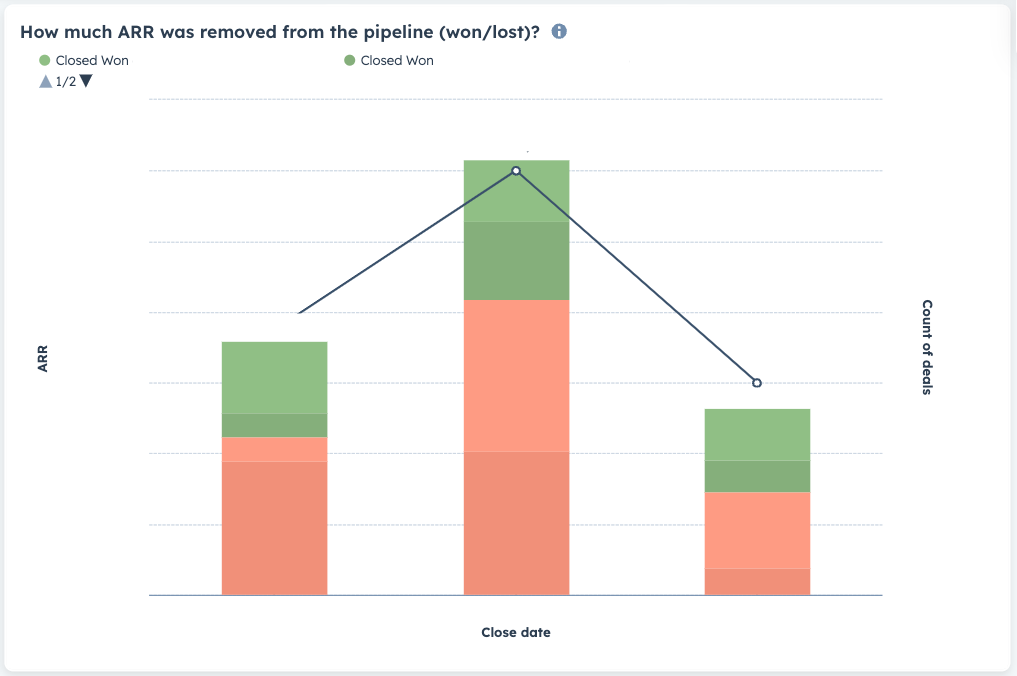
- Report B: “How much ARR was removed (won/lost)?”
- Builder: Custom report → Single object → Deals
- Filters: Close date = This year; Deal stage is any of Closed won or Closed lost
- Display: Quarterly (or Monthly) stacked bars (green = Won, red = Lost), with a line for Count