Understanding the health of your sales pipeline is crucial for accurate forecasting and resource allocation. One effective way to assess your pipeline is by performing a cohort analysis to evaluate close rates based on the age of your deals.
This analysis helps identify if a “zombie pipeline”—deals that are unlikely to close but still remain open—is affecting your sales metrics.
In this guide, I’ll walk you through setting up a cohort analysis in HubSpot CRM to analyse your close rates based on deal age. We’ll cover creating calculated properties, setting up reports, and interpreting the results to make data-driven decisions.
By the end of this guide, you’ll have a clear understanding of how deal age impacts your close rates and what actions you can take to optimise your sales process.
The challenge
Companies often face challenges in accurately assessing their pipeline due to:
- Zombie pipelines: Accumulation of stagnant deals that inflate the pipeline value and skew close rates.
- Artificially high close rates: Only closing deals that are won while leaving lost deals open can misrepresent your actual performance.
- Ineffective forecasting: Inability to predict sales accurately due to unreliable pipeline data.
- Resource misallocation: Misguided hiring or resource planning based on inflated pipeline metrics.
The solution overview
We’ll perform a cohort analysis in HubSpot CRM to:
- Segment deals based on age cohorts: Group deals by how long they’ve been open.
- Calculate close rates for each cohort: Determine the percentage of deals closed-won versus closed-lost within each age group.
- Visualise distribution of deal ages: Understand how deals are spread across different age cohorts.
- Identify patterns: Spot trends that indicate when deals become less likely to close.
- Make informed decisions: Use insights to clean up your pipeline, improve forecasting, and optimise sales efforts.
Video walk-through
Step-by-step guide
Step 1: Analyse your sales cycle length
Why this is important
Understanding your typical sales cycle length helps you determine appropriate cohorts for analysis.
How to do it
-
Review historical data:
- Look at past deals to calculate the average time it takes to close a deal.
- Identify any patterns or anomalies in deal durations.
-
Determine cohort ranges:
- Based on your typical sales cycle, define age intervals for your cohorts (e.g., 0-25 days, 26-50 days, etc.).
- Ensure the cohorts cover the full range of deal ages in your pipeline.
Step 2: Create the ‘Deal Age Cohort’ calculated property
Why this is important
This property categorises deals into age cohorts for analysis.
How to do it
-
Create a new calculated property:
- Object type: Deal
- Group: [Choose appropriate group]
- Label: Deal Age Cohort
- Field type: Calculation
-
Configure the custom equation:
- Choose Calculation type: Custom equation.
- Set Output type: Number.
-
Define the equation using IF statements:
-
Use the IF function to assign cohort labels based on the Days to Close.
Example equation:
IF([Days to close] <= 25, "Up to 25 days",
IF([Days to close] <= 50, "26-50 days",
IF([Days to close] <= 100, "51-100 days",
IF([Days to close] <= 200, "101-200 days",
IF([Days to Close] <= 300, "201-300 days",
"Over 300 days")))))
Note: Adjust the cohort ranges based on your sales cycle and the question you're looking to answer with your cohort analysis.
-
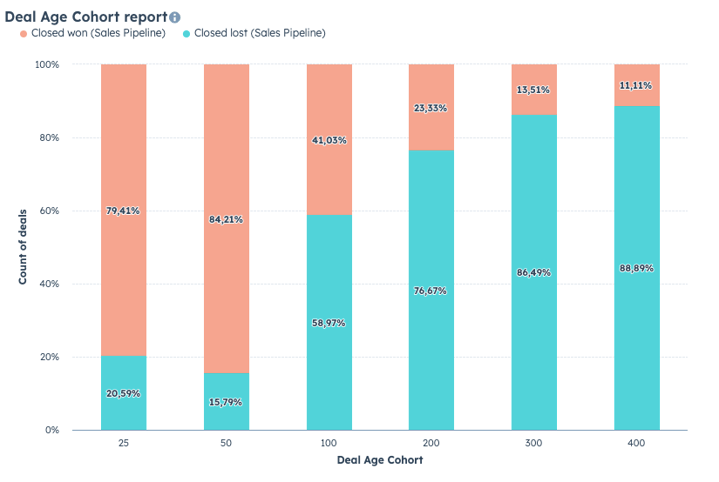
Step 3: Create the cohort analysis report
Why this is important
The report visualises your close rates across different deal age cohorts.
How to do it
-
Navigate to the reports section:
- Go to Reports > Reports.
- Click on Create custom report.
-
Select report type:
- Choose Single object report.
- Select Deals as the primary object.
-
Configure the data:
-
Filters:
- Deal Stage is Closed Won or Closed Lost.
- Days to Close is known and greater than 1 (to exclude erroneous data).
- Date Range: This year to date (adjust as needed).
-
Visualisation:
- X-Axis: Deal Age Cohort.
- Y-Axis: Count of deals.
- Break down by: Deal Stage.
-
-
Configure display options:
- Choose Bar Chart as the chart type.
- Set Display Options to show percentages for easier comparison.
-
Save and add to dashboard:
- Click Save.
- Name the report Close Rate by Deal Age Cohort.
- Add it to your monitoring dashboard.
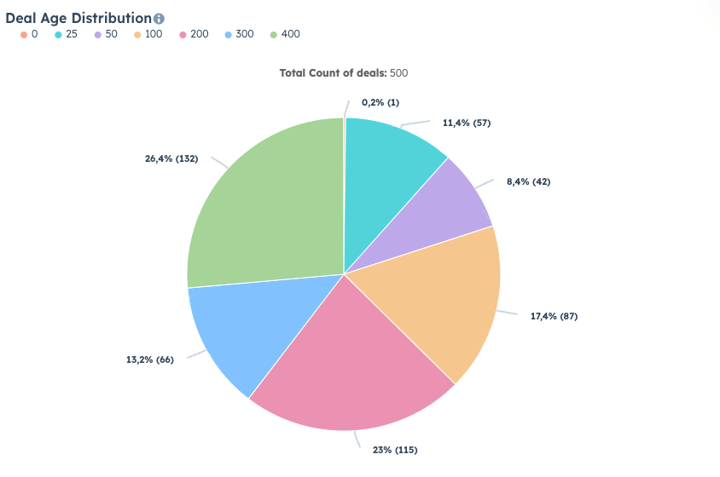
Step 4: Create a distribution report of deal ages
Why this is important
Understanding the distribution helps you see how many deals fall into each cohort.
How to do it
-
Create a new custom report:
- Go to Reports > Reports.
- Click Create custom report.
-
Select report type:
- Choose Single object report.
- Select Deals as the primary object.
-
Configure the data:
-
Filters:
- Days to Close is known and greater than 1.
- Date Range: This year to date (adjust as needed).
-
Visualisation:
- Chart Type: Pie Chart.
- Slice by: Deal Age Cohort.
- Metric: Count of deals.
-
-
Configure display options:
- Set the chart to display percentages.
-
Save and add to dashboard:
- Click Save.
- Name the report Deal Age Distribution.
- Add it to your dashboard.
Stay tuned for more insights on achieving a leaner, easier, and more profitable growth journey.

